

Hey there! If you reached this blog I guess that you are struggling with Grafana Helm chart to make it work with your LDAP. Seek no more, you just got to the place that you were searching for.
Introduction
If you have used Grafana before you might know that there are several integrations for authentication. We already talked in another post about how to integrate Grafana with Google SSO based on a docker container, but this time we will be focusing in doing a full installation over Kubernetes with another authentication method: LDAP.
As you probably know, LDAP is widely used in a very large number of companies and therefore it makes sense to integrate it with our dashboarding solution if we are already using it.
Requirements
We are expecting:
- You already have an LDAP server running up somewhere. We are using an OpenLDAP in our side.
- You already have a Kubernetes cluster up and running and it’s accessible with “kubectl”. You should be ok using minikube, though.
We are ready to go!

Install helm
First of all we need to be running helm. If you already have it installed you can jump to the next section. For this guide we will be using helm v2.16.12:
sudo wget -c https://get.helm.sh/helm-v2.16.12-linux-amd64.tar.gz -O - | tar -xz
sudo cp linux-amd64/helm /usr/local/bin/
Now we need to initialize it in our cluster. This command will install tiller:
helm init
Note that if you encounter any permission errors about when using helm then you will need to create a ClusterRoleBinding for tiller. In the official helm docs this is explained.
Generate LDAP configuration
Next, we are going to create our LDAP configuration for Grafana with all the parameters required for the integration. This step is based in the official Grafana docs.
Go ahead an create a new file called “ldap-toml“. Note that this name is mandatory since we need to create a secret from it and the helm chart will expect it to contain “ldap-toml” key.
The most relevant fields that you might want to modify are: “host“, “bind_dn“, “bind_password” and “search_base_dns“. Feel free to modify the contents as per your needs:
[[servers]]
# Ldap server host (specify multiple hosts space separated)
# We use OpenLDAP but you can use any IP address or external host here
host = "openldap.kube-system.svc"
# Default port is 389 or 636 if use_ssl = true
port = 389
# Set to true if LDAP server supports TLS
use_ssl = false
# Set to true if connect LDAP server with STARTTLS pattern (create connection in insecure, then upgrade to secure connection with TLS)
start_tls = false
# set to true if you want to skip SSL cert validation
ssl_skip_verify = true

# Search user bind dn
bind_dn = "cn=admin,dc=mycompany,dc=org"
# Search user bind password
bind_password = "admin"
# User search filter, for example "(cn=%s)" or "(sAMAccountName=%s)" or "(uid=%s)"
search_filter = "(cn=%s)"
# An array of base dns to search through
search_base_dns = ["ou=Users,dc=mycompany,dc=org"]
# Specify names of the LDAP attributes your LDAP uses
[servers.attributes]
name = "givenName"
surname = "sn"
username = "cn"
member_of = "memberOf"
email =  "email"
Save the file and create a new secret from it:
kubectl create secret generic grafana-ldap-toml --from-file=ldap-toml
Now we will create the grafana-values.yaml file that will be provided helm to enable LDAP in Grafana with the proper parameters. The relevant part of this values file for LDAP integration is:
grafana.ini:
  server:
    domain: grafana.mydomain.com
  auth.ldap:
    enabled: true
    allow_sign_up: true
ldap:
  enabled: true
  existingSecret: "grafana-ldap-toml"
Again, feel free to adapt the above parameters to your requirements. If you need to enable persistence, the ingress or anything else just add it to the values file. You can take a look at the official chart reference values.
Installing chart
Finally we can install Grafana in our cluster!
helm upgrade --install grafana grafana/grafana --namespace monitoring-system -f grafana-values.yaml
Once the installation finishes you can access to test the integration. If you didn’t enable ingress you can port-forward to it and access at http://localhost:8000 address using the following command:
kubectl -n monitoring-system port-forward svc/grafana 8000:80
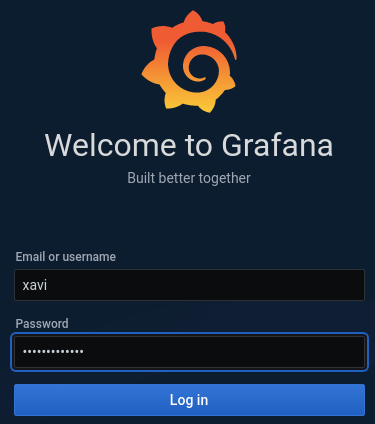
Now, try to login with an existing LDAP user:
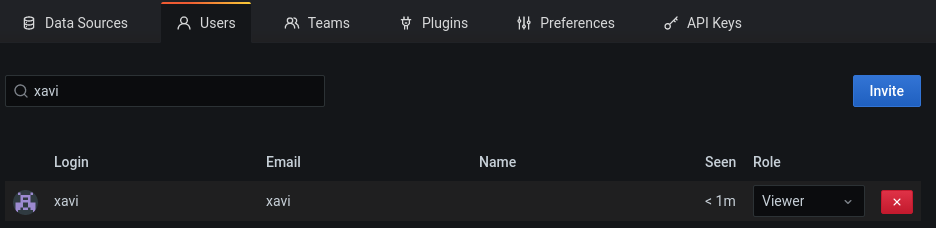
If we go now to settings -> Users we can see that my username was created with role “Viewer”. Here we can set any role we might want for this user.
We are done!

Conclusion
As you can see it was not so hard to do our LDAP integration when deploying Grafana in Kubernetes, but the helm chart documentation is not clear enough sometimes. The documentation tells you about what kind of value the chart will expect for a certain key but it’s a bit confusing in some areas such as LDAP configuration where we need to mix different values.
You can now work further by yourself in fully automating Grafana deployment with LDAP integration, for example to automate the secret creation or whatever you may need.
I hope I could bring a little bit of light over it and that you’ll be able to implement it in your own cluster.
In any case, if you have any doubt or have some suggestions, don’t hesitate to contact us!
Thanks for reading!