

Patching equipment with Patch Manager
Introduction to SSM
SSM is the acronym for Systems Manager, a set of tools that make our lives easier, not only for accessing machines through a virtual console, but also for executing remote commands, extracting records from the equipment, and of course , apply updates.
With the SSM software suite, you can update not only EC2 instances, but also on-prem computers, as well as virtual machines, on-the-edge (IoT) computers such as raspberrys, etc.
Systems Manager is a service that runs an agent on the computer itself (ec2 / on-prem, etc), in the same way as virtual agents in VMware environments, used to extract metrics from the instances, but in the case of SSM the console management is remote, or what is the same, it is divided into different end-points. That is why the agent must communicate with the SSM service over the network. The computers that want to be managed must have not only the agent installed but also network connectivity to reach the AWS SSM endpoints.
In this article we have used a couple of EC2 instances, one Linux and one Windows:
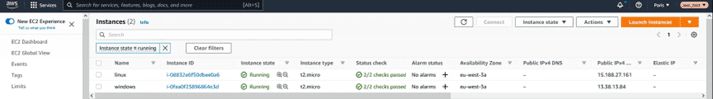
For Linux we have used a RedHat AMI, and in the case of the Windows computer, it is version 2019.
Role for SSM
In order for the computer to communicate with SSM, a role is required. For this reason we are going to generate a new “service role”, accessing the IAM section and selecting the “Roles” option and clicking on the “Create role” button:
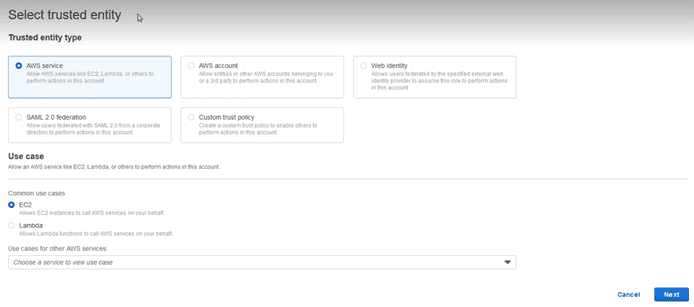
We select the “AWS Service” as “Trusted entity”, and below in the “Use case” section, the EC2 service. We select the following and add the policies that are necessary:
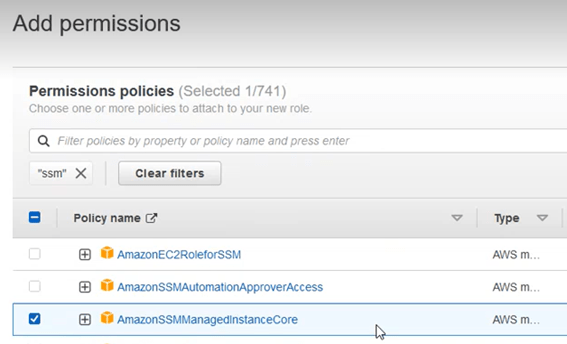
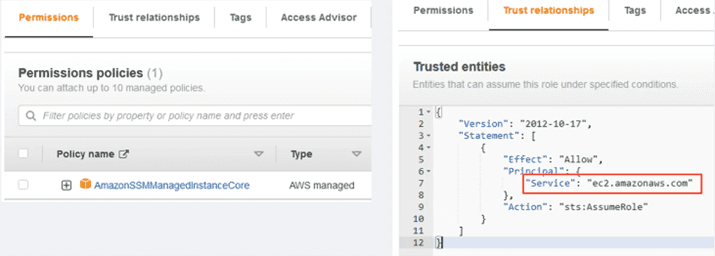
To do this, enter the name “ssm” in the search box, and choose from the options that appear the “AmazonSSMManagedInstanceCore”
We assign the name we want and make sure that in the “trusted entities” section, the value of “principal” selected is the service “ec2.amazonaws.com”, the service with which this role is going to be invoked and to which we are giving permission:
The next step will be to add this role to the instances. The easiest way is to mark the instance to be modified from the panel, as shown in the image.
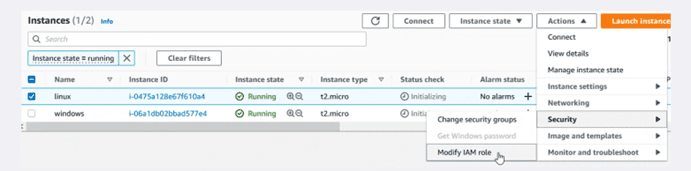
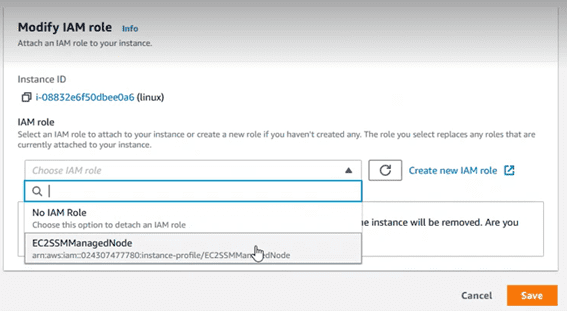
In the dropdown, assign it the role that we just created.
EC2 instances / managed nodes
In our case, we deployed a RedHat machine for the Linux variety for a reason: The official AMIs distributed by RedHat do not have the agent built-in, just like Windows AMIs distributed by Microsoft, or Amazon Linux AMIs do.
In case our distribution is agentless, it can be installed manually. Check the following link to see which distributions are supported:
https://docs.aws.amazon.com/systems-manager/latest/userguide/sysman-manual-agent-install.html
In the case of RedHat we will proceed to install it with a command like the following:
sudo yum install -y https://s3.amazonaws.com/ec2-downloads-windows/SSMAgent/latest/linux_amd64/amazon-ssm-agent.rpm
There are also binaries available for installing the agents for Windows or MacOS environments.
Fleet Manager
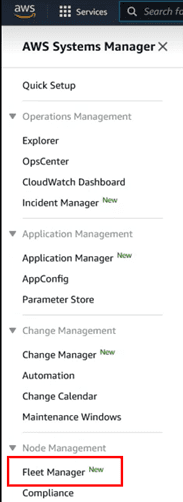
Now that we have the computers with the SSM agent installed and with the associated “service role”, we could access the “fleet manager” section, where the computers managed with SSM are displayed as a record, both EC2 computers and on-prem equipment, etc. This tool is within the SSM options:
The devices managed through SSM are called nodes, which is why, in the view of this service, the registered devices are identified in the “Node Id” column:
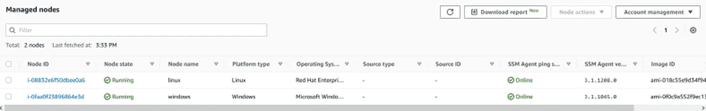
The computers that appear are those that are registered in the current region. Keep in mind that AWS SSM is a regional service, which means that if we have an account in several regions, it will be necessary to repeat the process described in this article for each region independently.
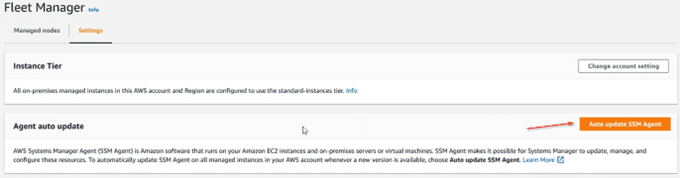
Like all software, the SSM agent receives constant improvements. It is therefore recommended to enable automatic updating in the “settings” section:
Baselines
Baselines are statements that define a certain level of compliance with a security policy. In the “patch manager” service there are different “baselines”, but it is highly recommended to create your own one with the configurations that interest us. It is a really simple process.
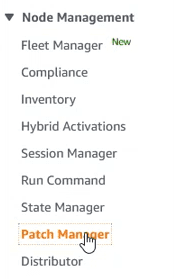
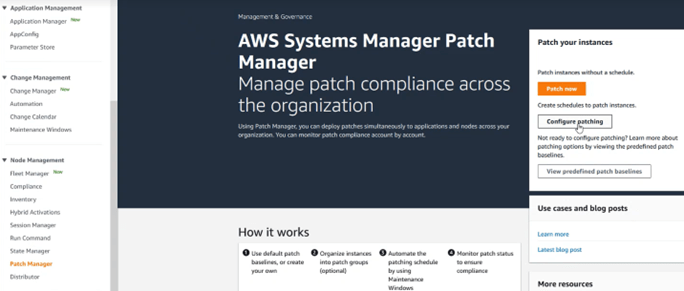
To access the “baselines” section, go to “Node Management” and select the “Patch Manager” option:
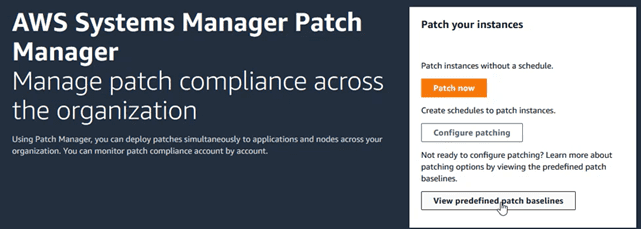
And on the screen that appears, access the “View predefined baselines” button
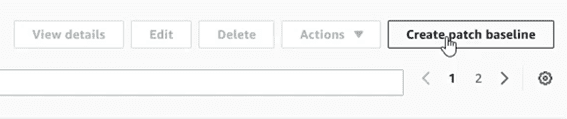
In the “baselines” view, there are a lot of them, each one for a different operating system. It is at this moment when we are going to create a personalized one. To do this, click on the “Create patch baseline” button.
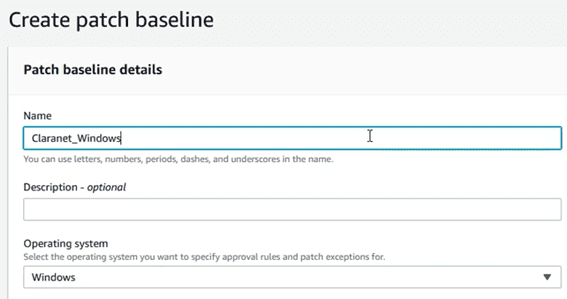
In the new section, select a name and an OS family that will be associated with the “baseline”:
Define the version of the OS, as well as other aspects that will define the level of compliance:
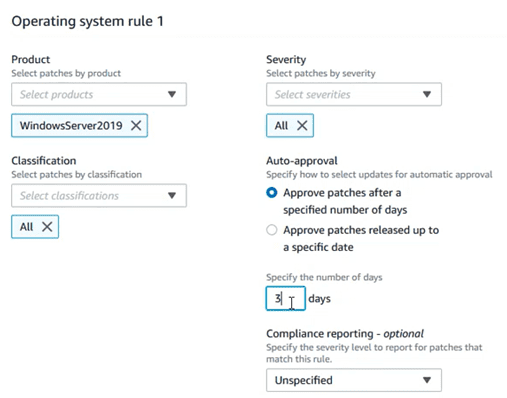
There are options such as “auto approval”, which allow you to approve the installation of a certain update, after a few days of its publication, or after a certain date, thus avoiding that day 0 patches, not very tested, could break stability of the teams. This would even allow PRE or TEST teams to install patches days before production teams as “canary testing”.
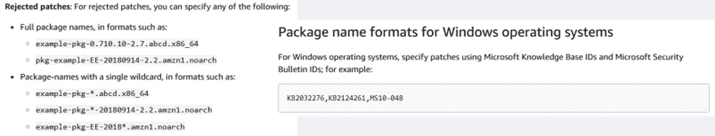
Just as important is the package exceptions section. This prevents the installation of certain packages that can break the service (systems with hand-compiled kernels, Windows packages that don’t get along with any other third-party program, etc).
To add exceptions the following format must be used:
At this moment we already have our own “baseline”. When the “baselines” are your own, to find them later, you have to specify that we are the owner. To do this, in the baseline search engine, specify “Owner: Self” as shown below:
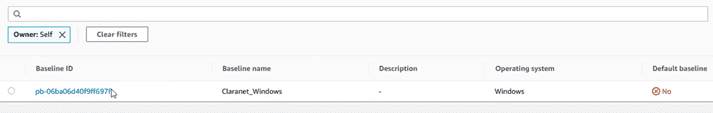
Otherwise the default view only shows standard baselines provided by AWS.
Patch groups
Once we have defined the “baselines”, we are going to define the “patch groups”. A “patch group” establishes the relationship between the “baselines” and the equipment on which they are going to be applied, depending on the value of a tag that we will specify later in the equipment.
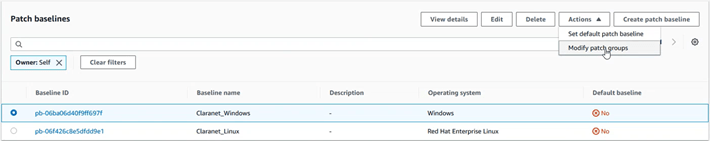
To create a “patch group”, it is very simple, we just have to select the “baseline” that we have just created, we display the “Actions” menu and select the “Modify patch groups” option.
A section will open to generate the patch groups, entering a name. In our case “Windows_Production”
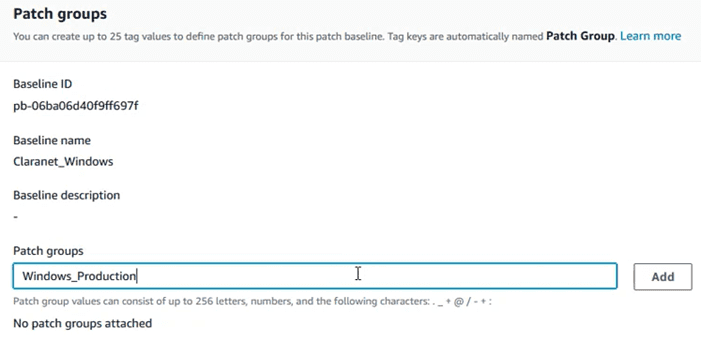
Once the name has been entered, taking care to respect the nomenclature, click on the “Add” button and close the wizard.
Tags
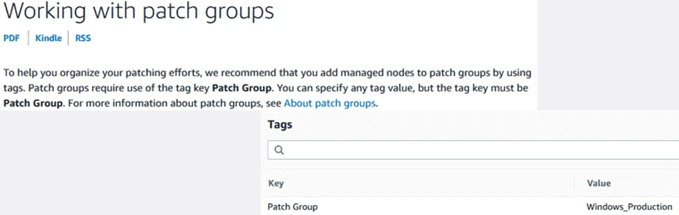
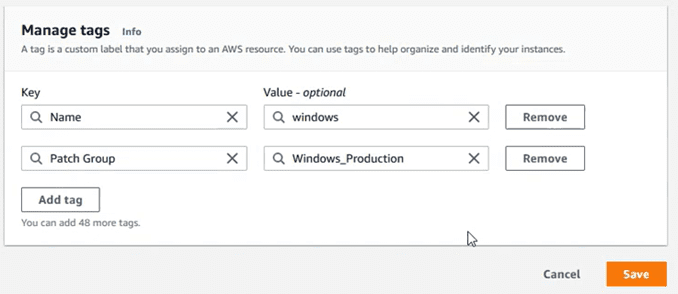
Tags are metadata that help us identify who owns a resource, a cost allocation unit, etc. In this case, with the tags we can also associate the nodes to the corresponding patch groups. For this, the same “Patch Group” tag value is always used. Eye! It is case sensitive
We go to the instances section, select one of them, and edit the tags section to add the “Patch Group”:
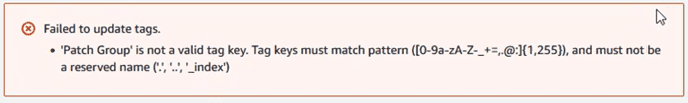
If when entering the tag, we find an error of the type “‘Patch Group’ is not a valid tag key.”
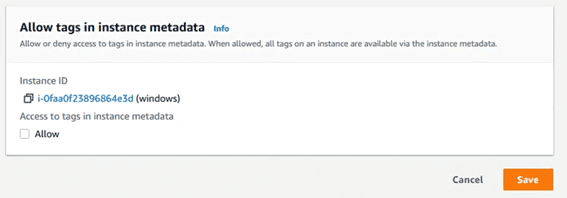
es necesario deshabilitar la check box de metadata tagging en la configuración de la instancia:
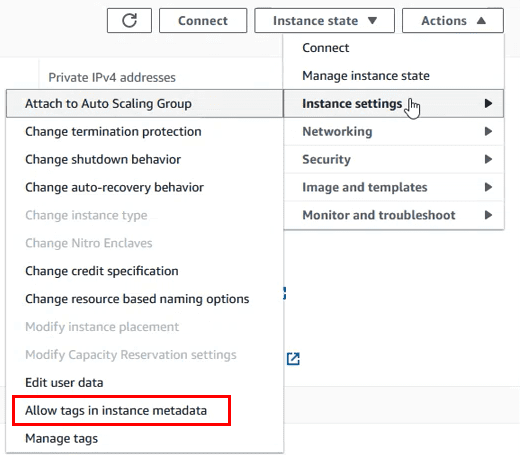
Dejar la casilla siguiente deseleccionada y volver a probar a añadir el tag en el equipo.
Maintainance Windows
Let’s recap. At this moment we already have the instance with the SSM agent installed and the role to interact with the service. We have created our own “baseline”, and then we have assigned it to some “patch groups”. Finally we have “tagged” the instances with a tag that points directly to the “pach group” that interests us.
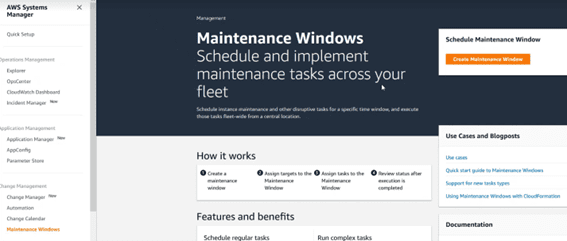
The maintenance windows are an important section because they not only contain the scheduling of the updates, but also the list of executions.
We are going to proceed by creating a maintenance window through the following section:
We must enter the name for the window, and set the cron. You can establish cron expressions with the typical nomenclature or by selecting the pre-established ones of every hour or every day.
The values of “Duration” and “Stop initiating task” are mandatory, and it is recommended to leave them with values such as the following:
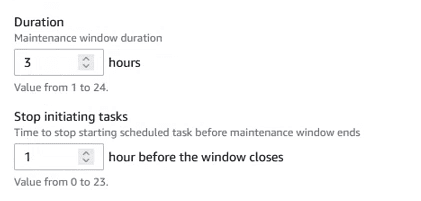
Finally, choose the time zone to match the schedules of the window with the one that interests us.
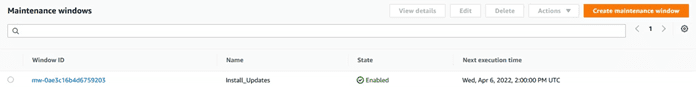
At the end we will have a list of the scheduled windows, and interesting data such as its next execution:
Patching configuration
At this time we are going to carry out the process that brings together all the previous steps, and that enables the “patch manager” to carry out system updates. To do this, access the “Patch Manager” section and click on “Configure Patching”
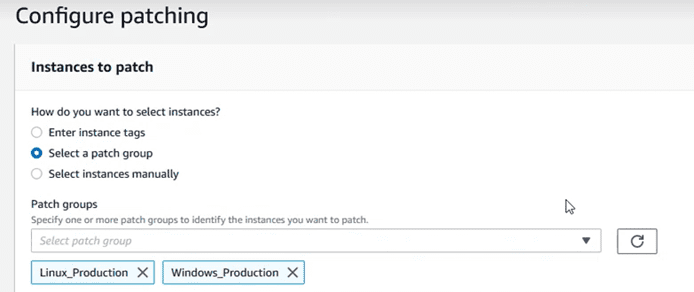
Choose the “patch groups” that you want to update:
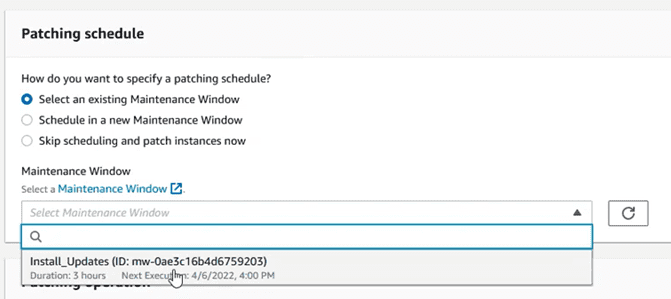
Choose the maintenance window that was created in the previous step:
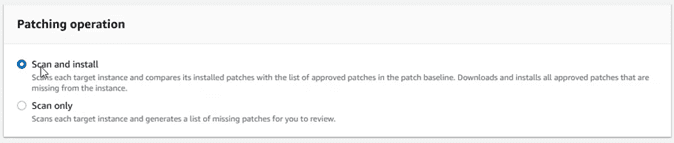
And leave the operation that best suits what we want to do. In this case we are going to choose “Scan and Install”
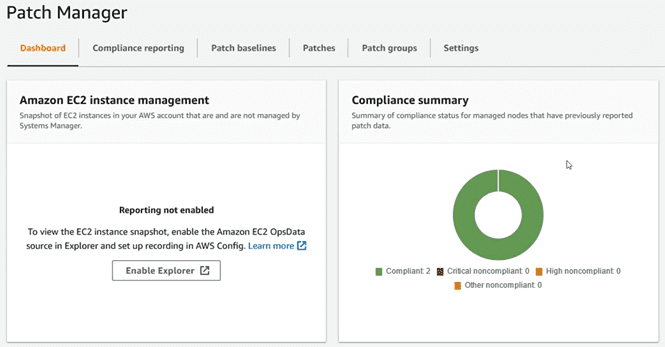
At this moment, in the “dashboard” of “Patch Manager”, we should have a view of equipment pending update. The values in this section will change depending on whether there are pending packages, update failures, etc.
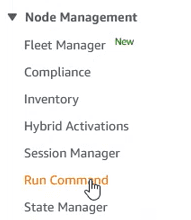
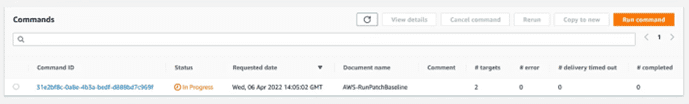
In order to track the actions performed, we can consult them in the “Run Command”
In this section there are two tabs. One with the commands currently running, which will come out with a clock next to it:
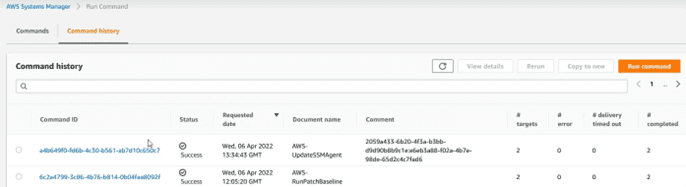
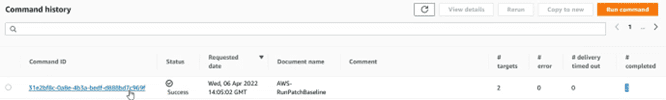
And another tab with the history of actions:
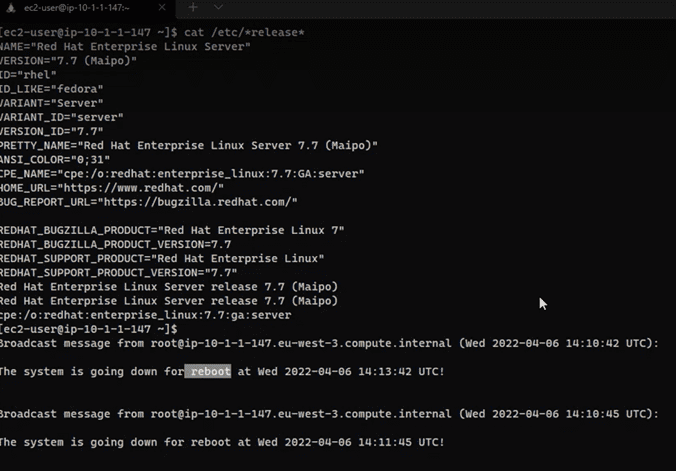
If in the process of installing updates, there is any package marked as restart required, the computer will restart immediately. Take this into account to establish the windows according to the needs of the business:
After the installation of the patches, and the reboots if any, in the “dashboard” of “Patch Manager” the instances will now appear as compliant according to the “baselines” established:
Cloudwatch
In the command history console, we can see the executed tasks, as in this case. If we click on the id of the task, we can access its details:
Inside we can see the computers on which the action has been executed, and we can, by selecting one of those computers, see the details of the operations. To do this, select and click on the “View output” button.
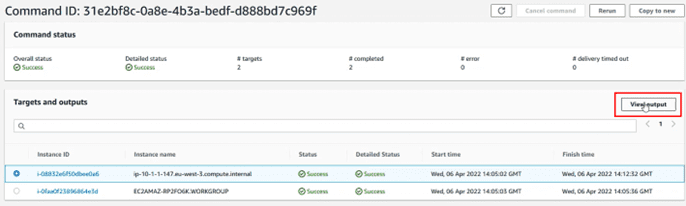
The operations are testing all the platforms, for this reason they will first try to execute the patching on a Windows, then on a Linux and finally on a MacOS. Therefore, to see the status of the updates, we choose the platform of the team we are consulting.
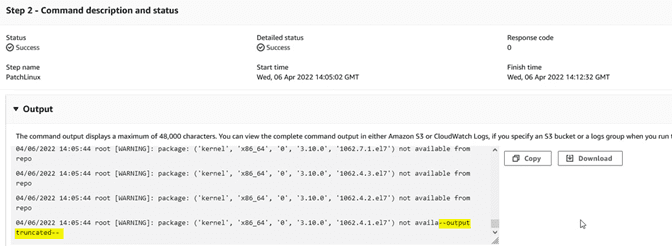
In the “Output” window we will see the record, but it is often truncated because it is excessively long:
If we want to consult this data, we can send it to a Cloudwatch “log group”. To do this, first we go to CloudWatch and create a “log group”:
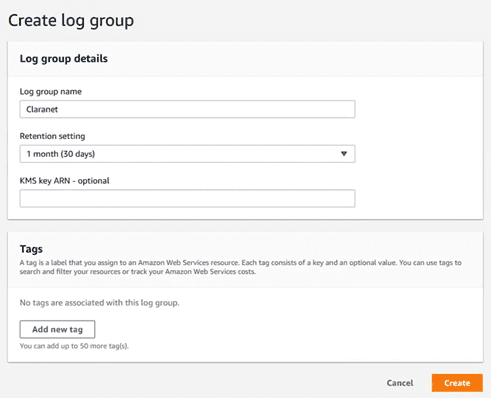
We put a name and specify the retention period.
The second step is to modify the role of the machine so that it has permissions to write to Cloudwatch, so you will have to add an “in-line policy” like this:
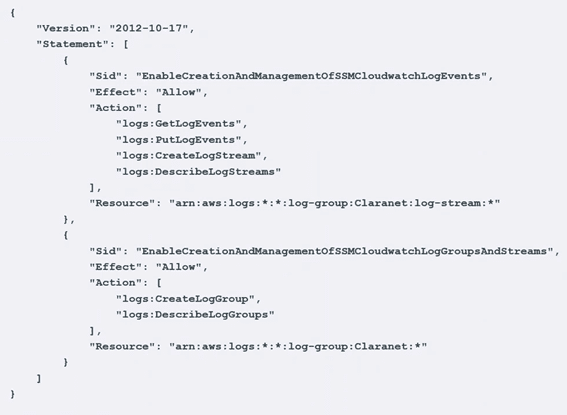
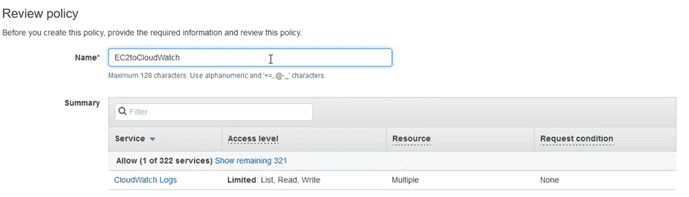
We put a name to this “policy” and save it:
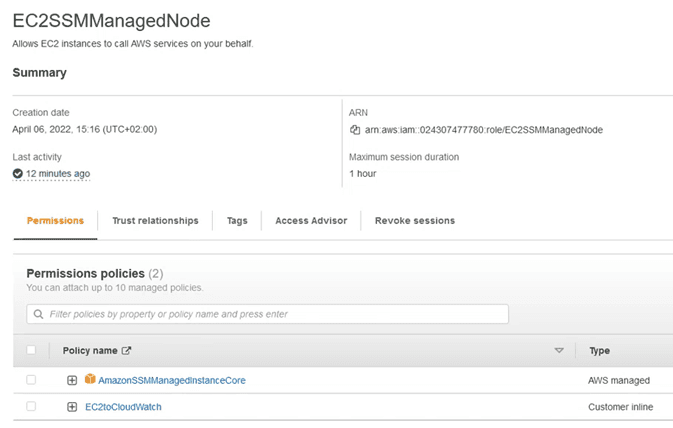
Leaving the role of the team as:
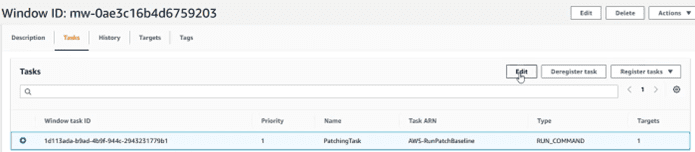
We return to the system manager, section “Maintenance Window” and within the tasks (I mark the task and select edit):
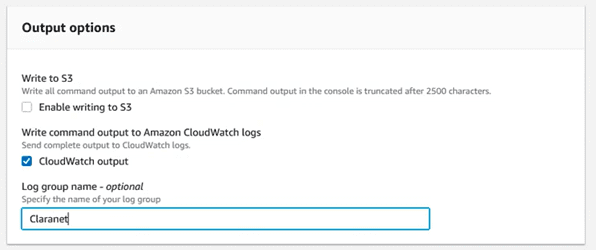
And in the “Output Options” section, write the name of the log group where we are going to send it:
We save the changes, and from now on when selecting the output of the tasks, we will see that a link to Cloudwatch appears:
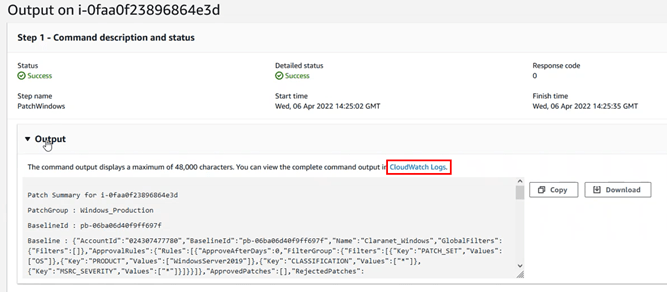
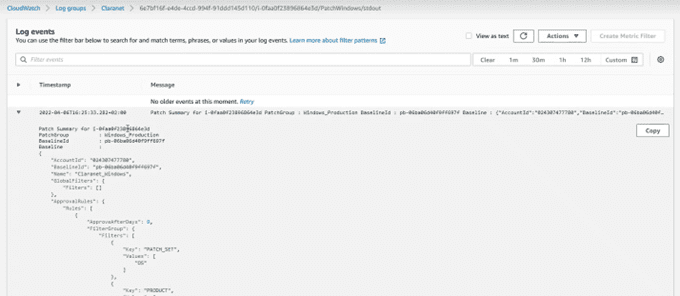
And if we consult that link, it will take us to the output information, but without truncating:
From Geko Cloud Consulting, we hope you liked this post and above all that you find it useful.
If you need information about the Cloud and DevOps world, we invite you to contact us and keep checking our blog to find other useful posts.