

Elasticsearch is a tool that allows indexing many types of content such as application logs, and in this article we will deal precisely with how to index the HTTP logs of a load balancer and proxy such as HAProxy, in the case of wanting to also record the fields of User-Agent, X-Forwarded-For and Referrer, which by default are not shown in the logs.
Currently on the market there are many tools available to forward these logs to Elasticsearch, and in this case we will use Filebeat because it is a simple tool to install and configure, and it perfectly fulfills its mission. It is also interesting to mention that it has been developed by the same company as Elasticsearch.
Although Filebeat already has a module for HAProxy that allows you to forward and index your logs in the default format, in case we want to add more fields to these logs or simply change their format, we will have to change the way Elasticsearch should do the data ingestion.
Adding more information to the HAProxy logs
Let’s suppose that we want the logs of HTTP requests to also show other fields such as User-Agent, X-Forwarded-For and Referrer, fields which are very good to have at your disposal when you want to monitor a website, but that they are not actually saved to the logs unless we specify it explicitly. To do this, simply add the following lines in the frontend sections of the HAProxy configuration file.
capture request header X-Forwarded-For len 15
capture request header User-Agent len 128
capture request header Referer len 128
Given that HAProxy by default stores in the logs the headers of the HTTP requests that have been set to be captured, it would not be necessary to do anything else except restart the service to apply the changes and verify that these fields are actually being shown in the logs.
Filebeat installation
Installing and configuring the Filebeat agent is very simple, just follow the instructions in the official documentation. It consists of the following steps:
- Agent installation based on operating system
- Elasticsearch / Kibana connection information settings.
- Module activation for HAProxy.
- Recommended resources load to Elasticsearch, such as index templates and some dashboards for Kibana.
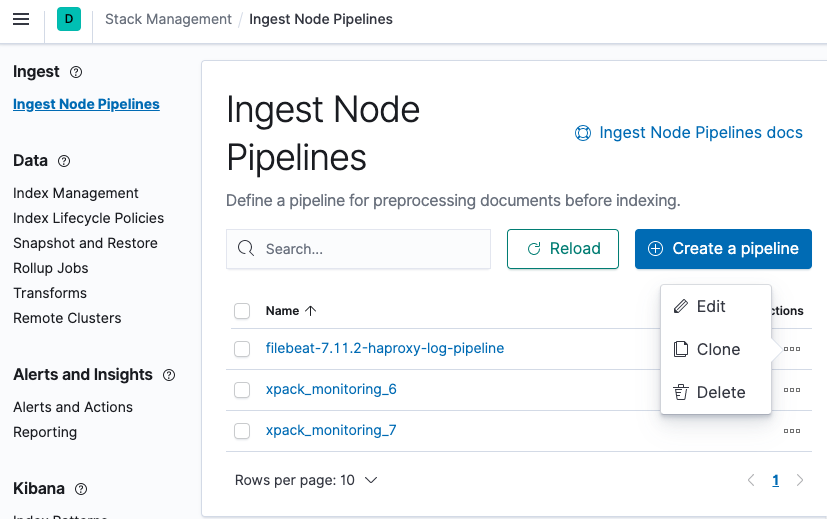
The first time the module connects to Elasticsearch it will create an ingest pipeline, which is the element that parses the logs.
Ingest Pipeline modification
By now we should be receiving the logs in Elasticsearch, but the User-Agent, X-Forwarded-For and Referrer fields would still not be visible despite being available in the HAProxy logs. This is because the ingest pipeline created by the Filebeat module does not take these fields into account, and therefore we will have to edit it.
We must edit the Grok processor patterns. When clicking on the processor to edit it, we should see the following patterns.
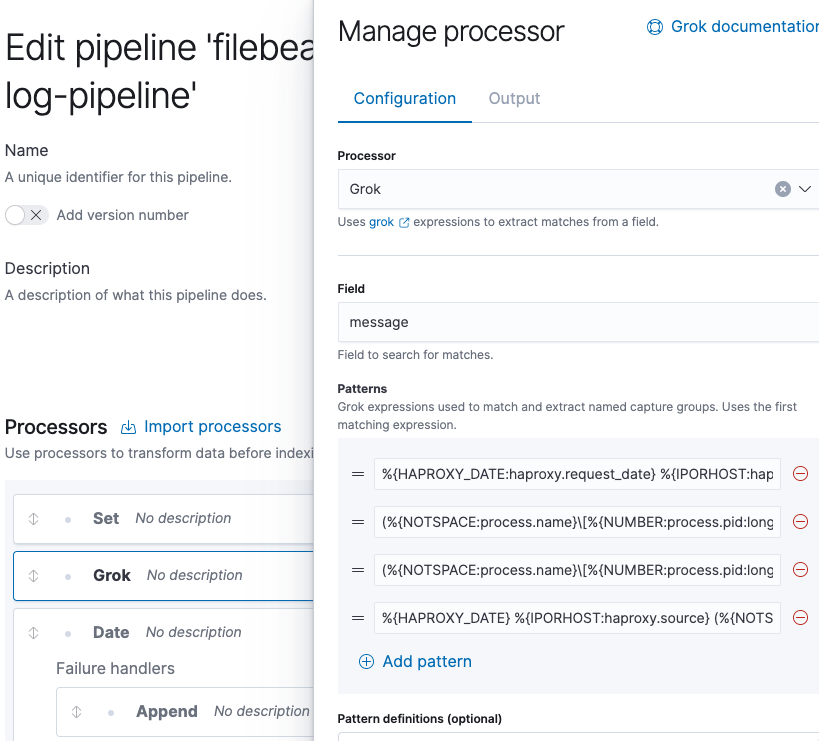
We must add a new one with the following content and move it to the second position.
(%{NOTSPACE:process.name}[%{NUMBER:process.pid:long}]: )?%{IP:source.address}:%{NUMBER:source.port:long} [%{NOTSPACE:haproxy.request_date}] %{NOTSPACE:haproxy.frontend_name} %{NOTSPACE:haproxy.backend_name}/%{NOTSPACE:haproxy.server_name} %{NUMBER:haproxy.http.request.time_wait_ms:long}/%{NUMBER:haproxy.total_waiting_time_ms:long}/%{NUMBER:haproxy.connection_wait_time_ms:long}/%{NUMBER:haproxy.http.request.time_wait_without_data_ms:long}/%{NUMBER:temp.duration:long} %{NUMBER:http.response.status_code:long} %{NUMBER:haproxy.bytes_read:long} %{NOTSPACE:haproxy.http.request.captured_cookie} %{NOTSPACE:haproxy.http.response.captured_cookie} %{NOTSPACE:haproxy.termination_state} %{NUMBER:haproxy.connections.active:long}/%{NUMBER:haproxy.connections.frontend:long}/%{NUMBER:haproxy.connections.backend:long}/%{NUMBER:haproxy.connections.server:long}/%{NUMBER:haproxy.connections.retries:long} %{NUMBER:haproxy.server_queue:long}/%{NUMBER:haproxy.backend_queue:long} {%{IP:source.ip}|%{DATA:user_agent.original}|%{DATA:http.request.referrer}} "%{GREEDYDATA:haproxy.http.request.raw_request_line}"
It is very important that this new pattern is placed in the second position since the processor will use the first expression that is matched and it will ignore the rest.
By now there should be a list of five patterns. Finally, we click the Update button and from that moment the new fields should already be visible.
I hope you’ve enjoyed this post and I encourage you to check our blog for other posts that you might find helpful. Do not hesitate to contact us if you would like us to help you on your projects.
See you on the next post!